

- Overview
- Climate change mitigation and adaptation
- GHG Management
- Air pollution management and prevention
- Water Resources and Waste Management
- Environmental Expenditures and Benefits
GHG Management
Management Approach (MA) for Material Topics

Inventory Framework
The Company compiles its GHG inventory in accordance with ISO 14064-1:2018, and commissioned BSI Taiwan to carry out verification according to ISO 14064-3:2019.

GHG Inventory Method


Plans of Subsidiaries to Compile an Inventory
According to the Sustainable Development Roadmap of TWSE/TPEx-listed Companies announced by the FSC in March 2022, companies with a capital of NT$10 billion and above must complete their GHG inventory in 2025 and complete verification in 2027. The Company's schedule was reported to the Board of Directors on December 12, 2024, and the implementation method planned is as follows:

Internal Carbon Pricing
To manage carbon emissions, evaluate the impact of carbon fee levies in advance, and ensure that all production plants have actual experience in implementing the carbon reduction plan, the Company uses the internal carbon pricing management mechanism to combine carbon emissions with financial impacts when promoting internal projects, which serve as important references for decision-making.

Greenhouse Gas Emission Status
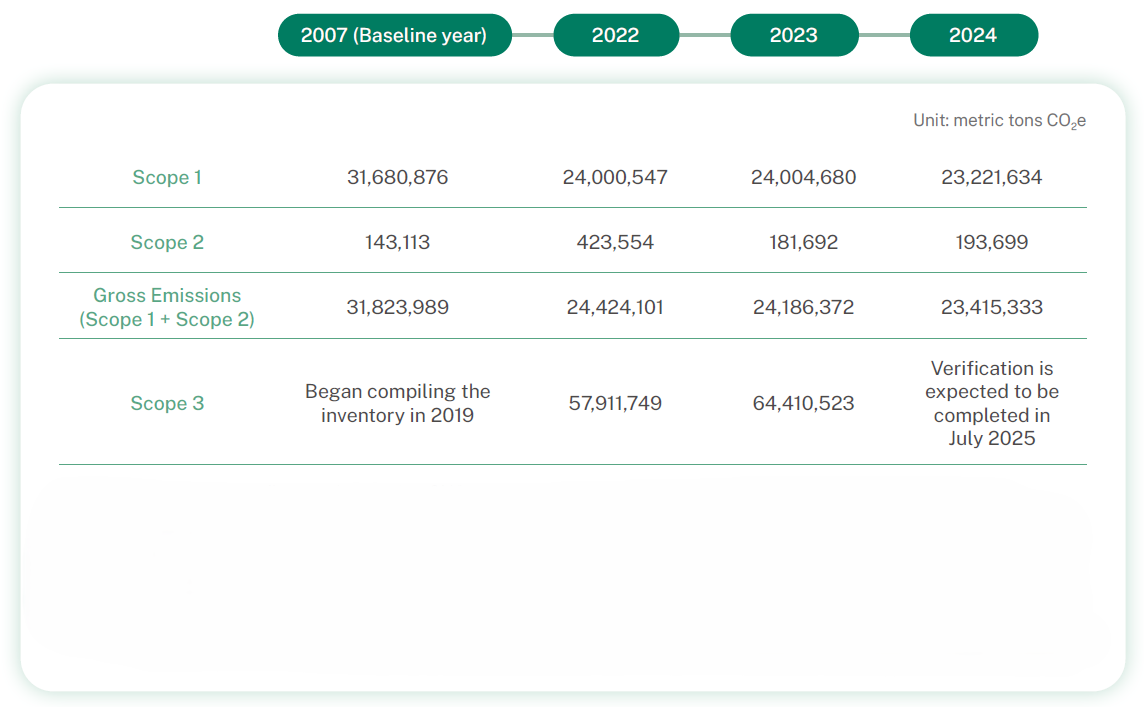 Note 1: Scope 1 refers to direct emissions, i.e., GHG emissions from burning fuel. The Company does not burn biomass.
Note 2: Scope 2 refers to indirect emissions from energy, i.e., GHG emissions from steam and electricity.
Note 3: Global warming potential (GWP) before 2016 is based on the second assessment report (SAR) of IPCC in 1995. GWP from 2016 to 2022 (inclusive) is based on the fourth assessment report of the IPCC in 2007. Starting from 2023, in accordance with the Ministry of Environment’s Guidelines for Greenhouse Gas Emission Inventory, GWP is based on the fifth assessment report of the IPCC in 2013. The emission factors for electricity and steam are in-house factors that have been validated by verification institutions
Note 4: Scope 3 refers to other indirect emissions, e.g. products and services purchased, fuel and energy related activities, and upstream (downstream) transportation and delivery
GHG Emission Intensity over the Years

Note: The boundaries of calculation are Scopes 1 and 2.
GHG emissions in 2024 decreased by 771,039 tons (-3.2%) compared to 2023. However, the GHG emission intensity per unit product of the oil & gas industry increased due to process load reduction and failure to achieve optimal operating conditions.
Breakdown of GHG Emissions in 2024

Note: The boundaries of calculation are Scopes 1 and 2.
Breakdown of GHG Emissions by Source in 2024 -Scope 1

Breakdown of GHG Emissions by Source in 2024 -Scope 2

Note: The Company does not have this quantitative information because there is no demand for thermal energy supply.